Comprehensive Reporting Tools in Work Order App
Reporting feature transforms data into actionable insights, empowering you to make informed decisions. From routine checklists to incident logs, our intuitive dashboard presents a holistic view of your operations.
Personalized Precision
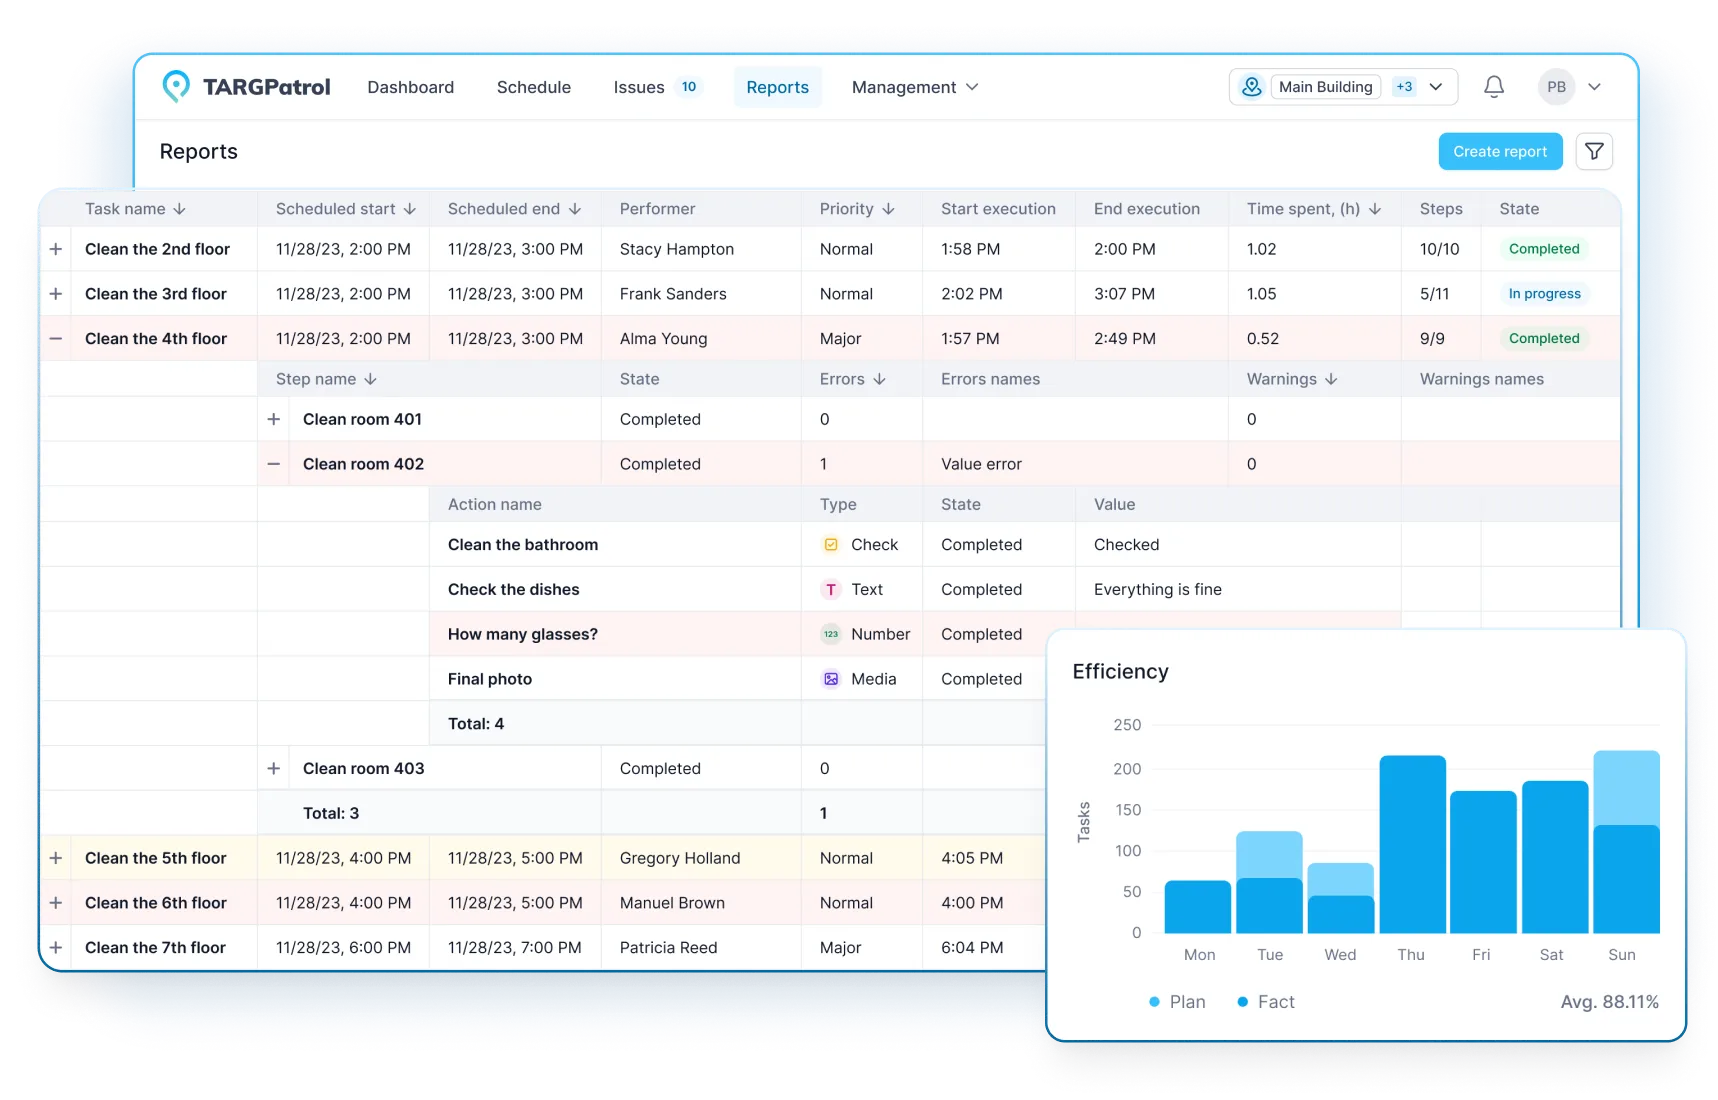
TARGPatrol's reporting tool recognizes the uniqueness of your operation. It allows you to customize every aspect of your reports to display the data that matters most to you, such as performance metrics, compliance issues, and task completion timelines. This customization ensures that the insights you receive are perfectly tailored to drive your operation's success.
With custom reporting feature, you can focus on key metrics like task progress, safety incidents, and equipment maintenance, ensuring your reports deliver the most crucial information efficiently.
Your reports offer crucial insights, allowing you to focus on key information and identify discrepancies. By honing in on data that aligns with your goals, you can clearly see strengths and areas for improvement.
With TARGPatrol, you can tailor reports to meet your specific needs, enabling you to make well-informed decisions. This customization allows for optimal process optimization and the discovery of new growth opportunities.
Real-Time Data to Stay Ahead
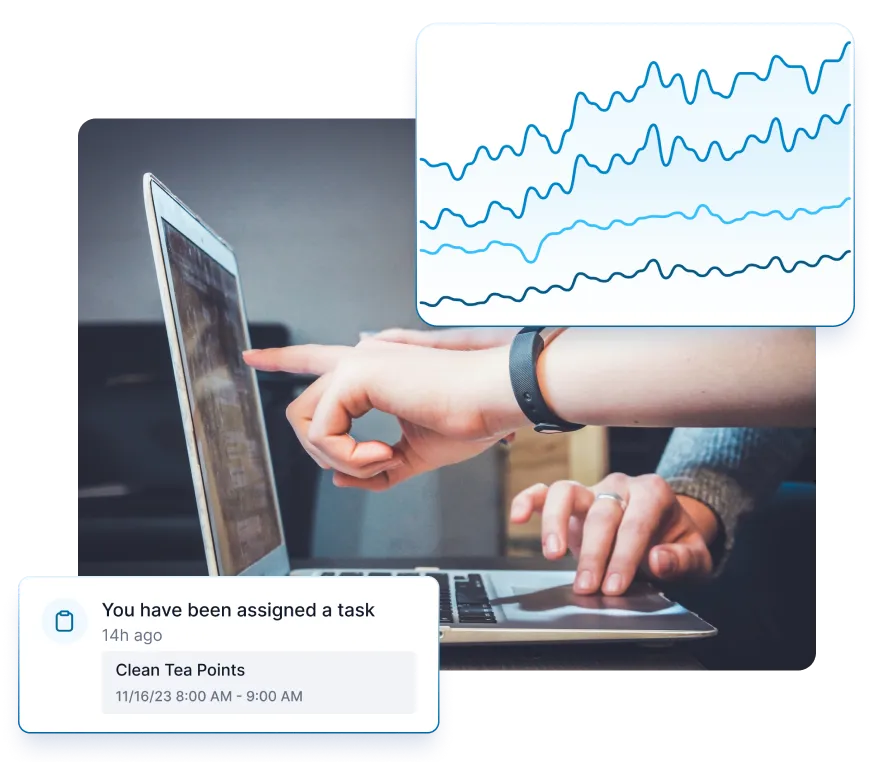
The best decisions are informed ones, and that requires access to the latest information. With TARGPatrol's Reporting, you're equipped with real-time data, allowing you to respond promptly to emerging situations, identify trends, and proactively address potential issues before they escalate.
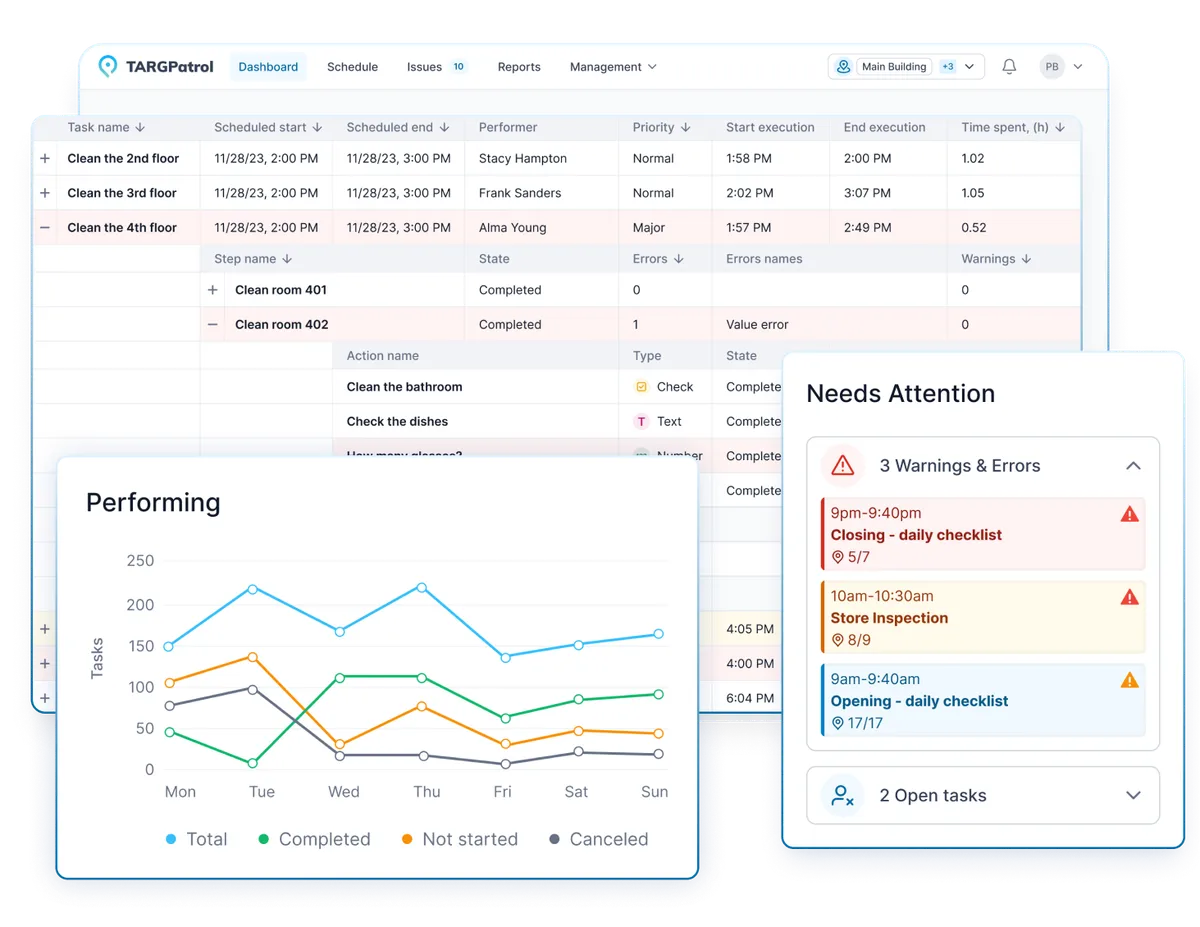
Utilize real-time data streams to gain immediate insights into your operation. Track employee tasks as they happen, allowing you to proactively manage and stay ahead of potential issues.
Configure personalized notifications to instantly receive updates on completed tasks, critical errors, or any difficulties encountered during task execution. Act swiftly based on these real-time alerts to manage situations effectively.
Leverage dynamic, real-time dashboards that update with the latest data to visualize employee workflows and monitor all details. Use interactive visualizations for an up-to-date and comprehensive overview of your operation.
Make decisions in the moment with analytics that reflect the most current information. Adapt strategies on the fly based on real-time insights, ensuring agility in operations.
Visual Analytics
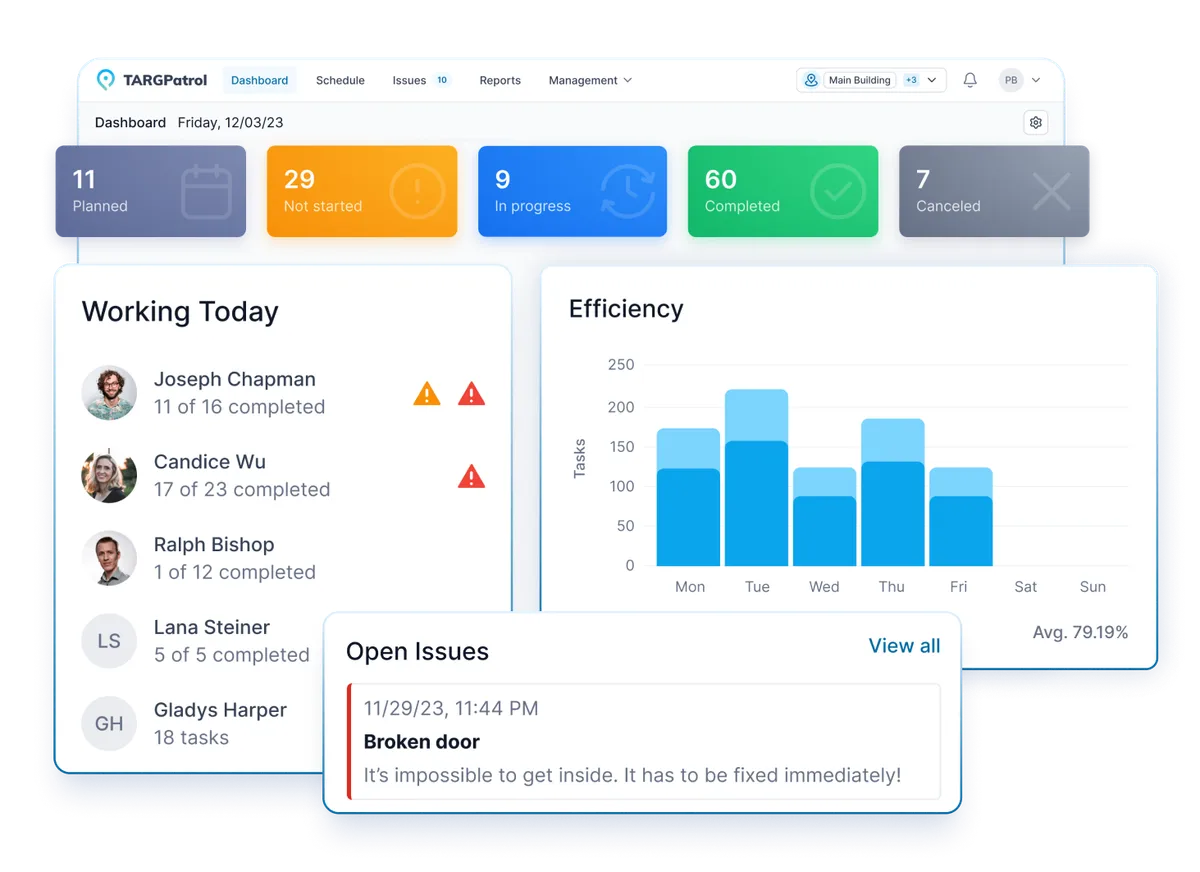
Raw data can be daunting, but our Dashboard feature simplifies it by converting it into intuitive visualizations. With our array of graphs, charts, and interactive dashboards, you can easily visualize information related to tasks, deadlines, and employee performance.
Use interactive dashboards to customize visualizations and track key metrics like task completion rates and planned timelines. Easily adjust views by zooming in on specific periods or filtering through parameters.
Visualizations enable you to quickly identify trends, anomalies, and patterns that might not be apparent in raw data. This rapid understanding allows you to address challenges and capitalize on opportunities.
Dashboard visualizations help you quickly identify performance improvements or issues, facilitating faster and more effective decision-making. Visual analytics enable clear communication of insights with your team.
Historical Trends
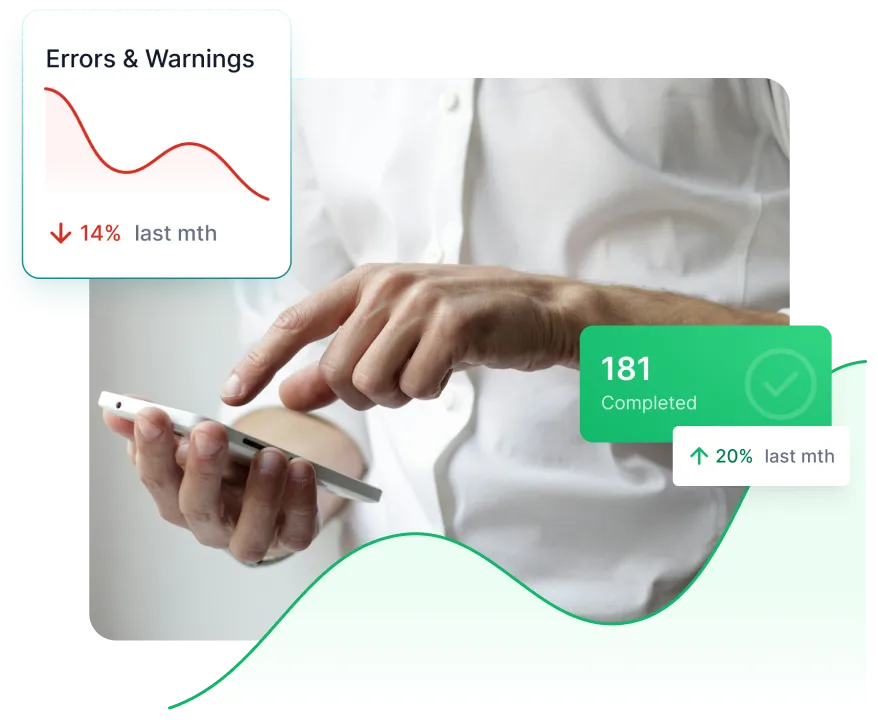
Explore historical data to guide your future with our Reporting tool. It provides trend analysis that helps you detect patterns, seasonal variations, and performance trends over time.
TARGPatrol's Reporting offers more than current insights: it provides a comprehensive view of the past. Explore data on tasks and issues over any period, tracking patterns and performance changes.
By understanding historical trends, you gain the ability to predict future patterns. Seasonal changes, recurring issues, and performance shifts become easier to plan for.
Historical reports provide insights into your operation, helping you adjust staffing levels, manage workload, and identify areas for targeted improvement.
Latest news

How to Automate Site Patrols and Territory Inspections
Learn how to automate site patrols with routes, schedules, checklists, QR codes, NFC, GPS, incident reporting, and real-time monitoring in TARGPatrol.
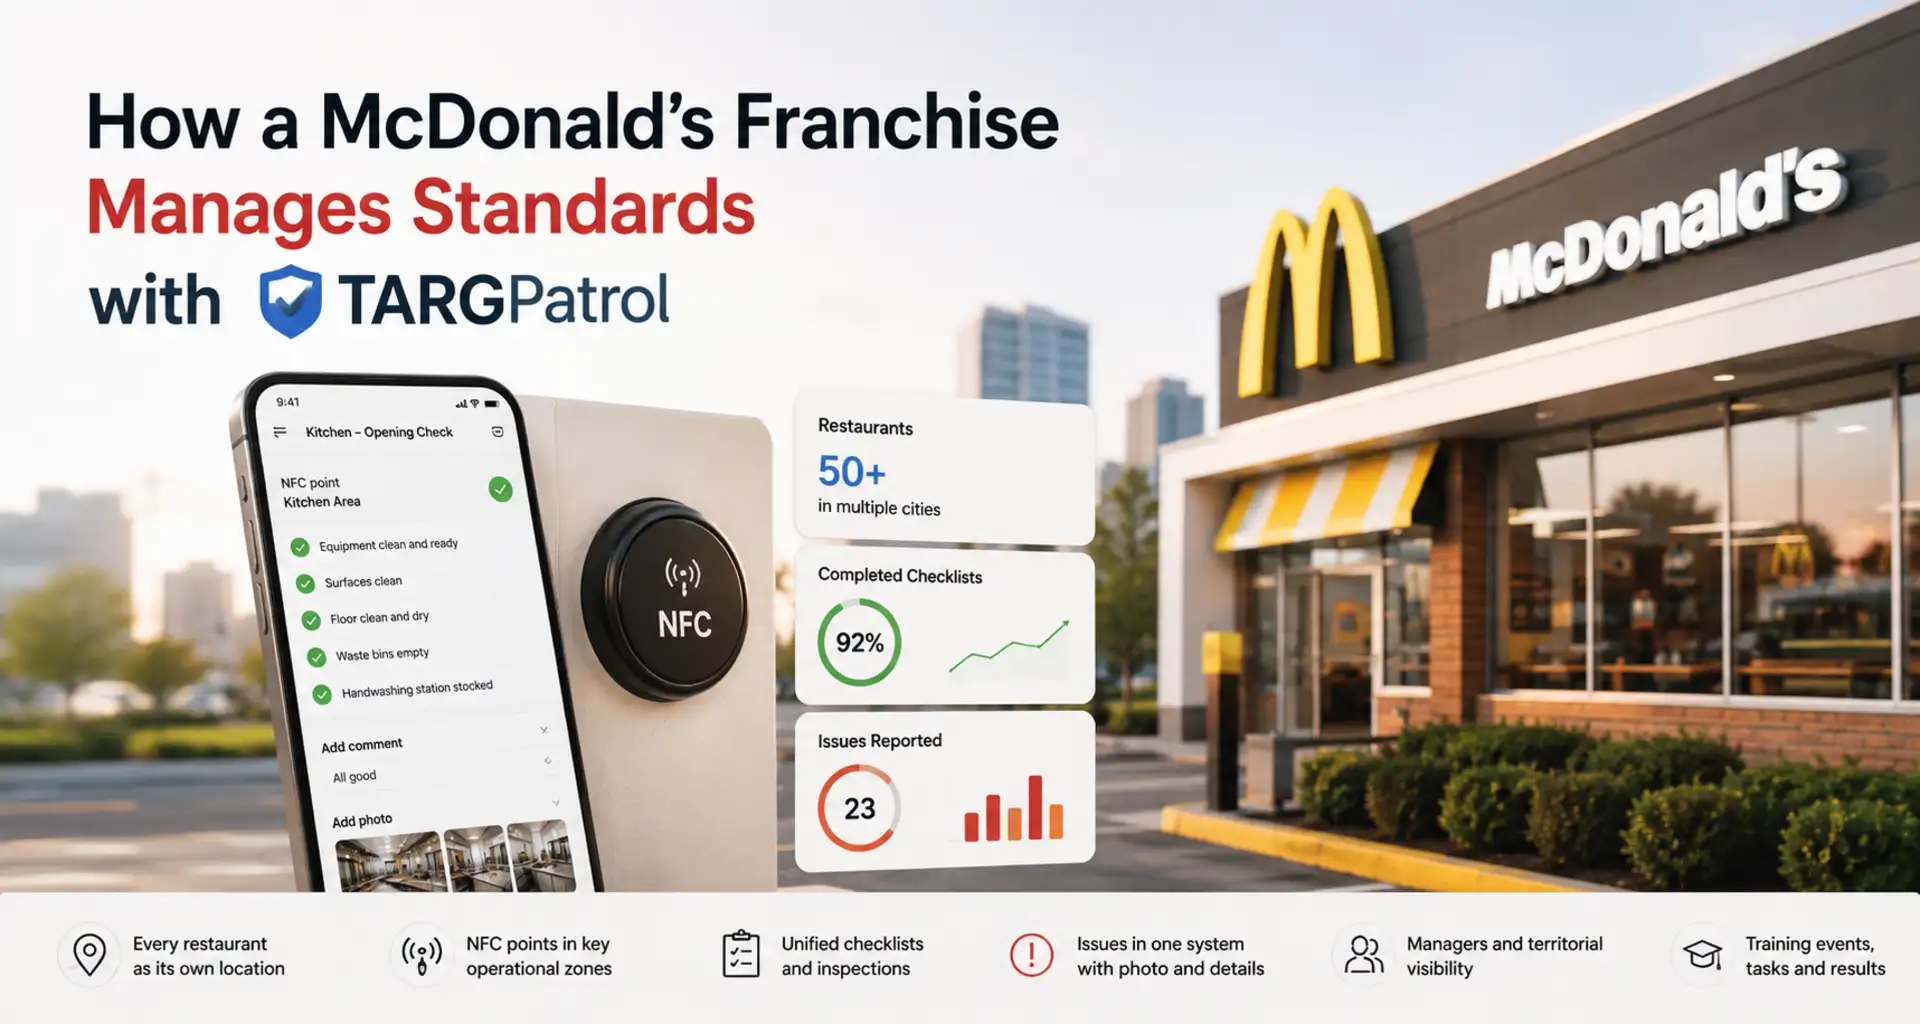
How a McDonald's Franchise Manages Standards with TARGPatrol
How a McDonald's franchise uses TARGPatrol App for quality control, operational inspections, compliance checks, staff training, and standards management.
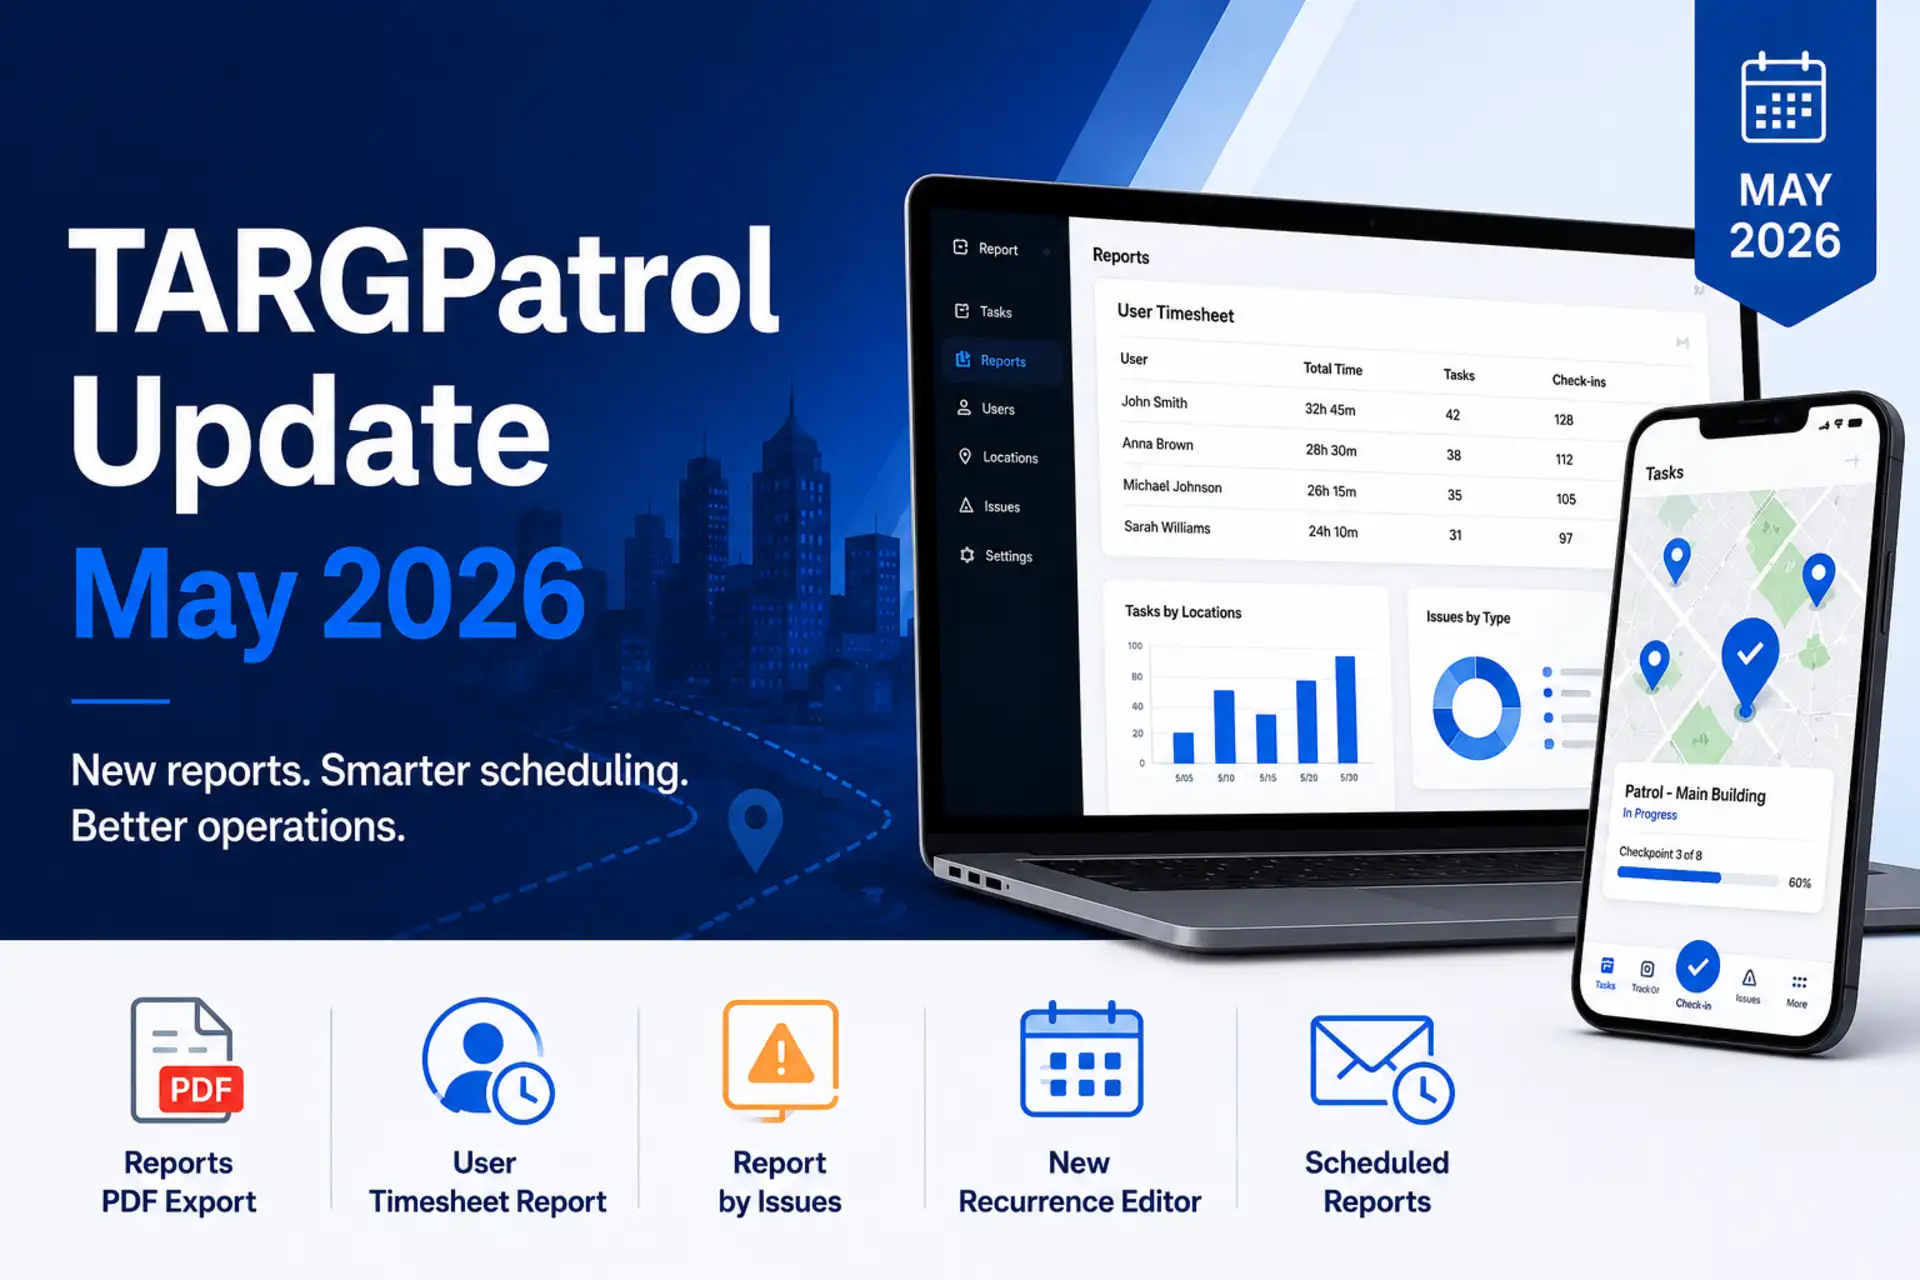
TARGPatrol Update May 2026
Explore TARGPatrol May 2026 updates: PDF exports, user timesheets, issue reports, scheduled reports, and task recurrence.
Client Success: Harnessing the Power of TARGPatrol's Functionality
Using TARGPatrol's Reporting feature has been a game-changer for us. The customizable reports allow us to focus on what truly matters for our operations. The real-time data access ensures that we stay proactive in addressing any issues. The visual analytics make it easy to interpret complex data, and the historical trends help us make informed decisions for the future.
Gary Adams
Efficiency Enhancement Achieved through Reports