How to Set Up Webhooks in TARGPatrol
Log in to TARGPatrol.
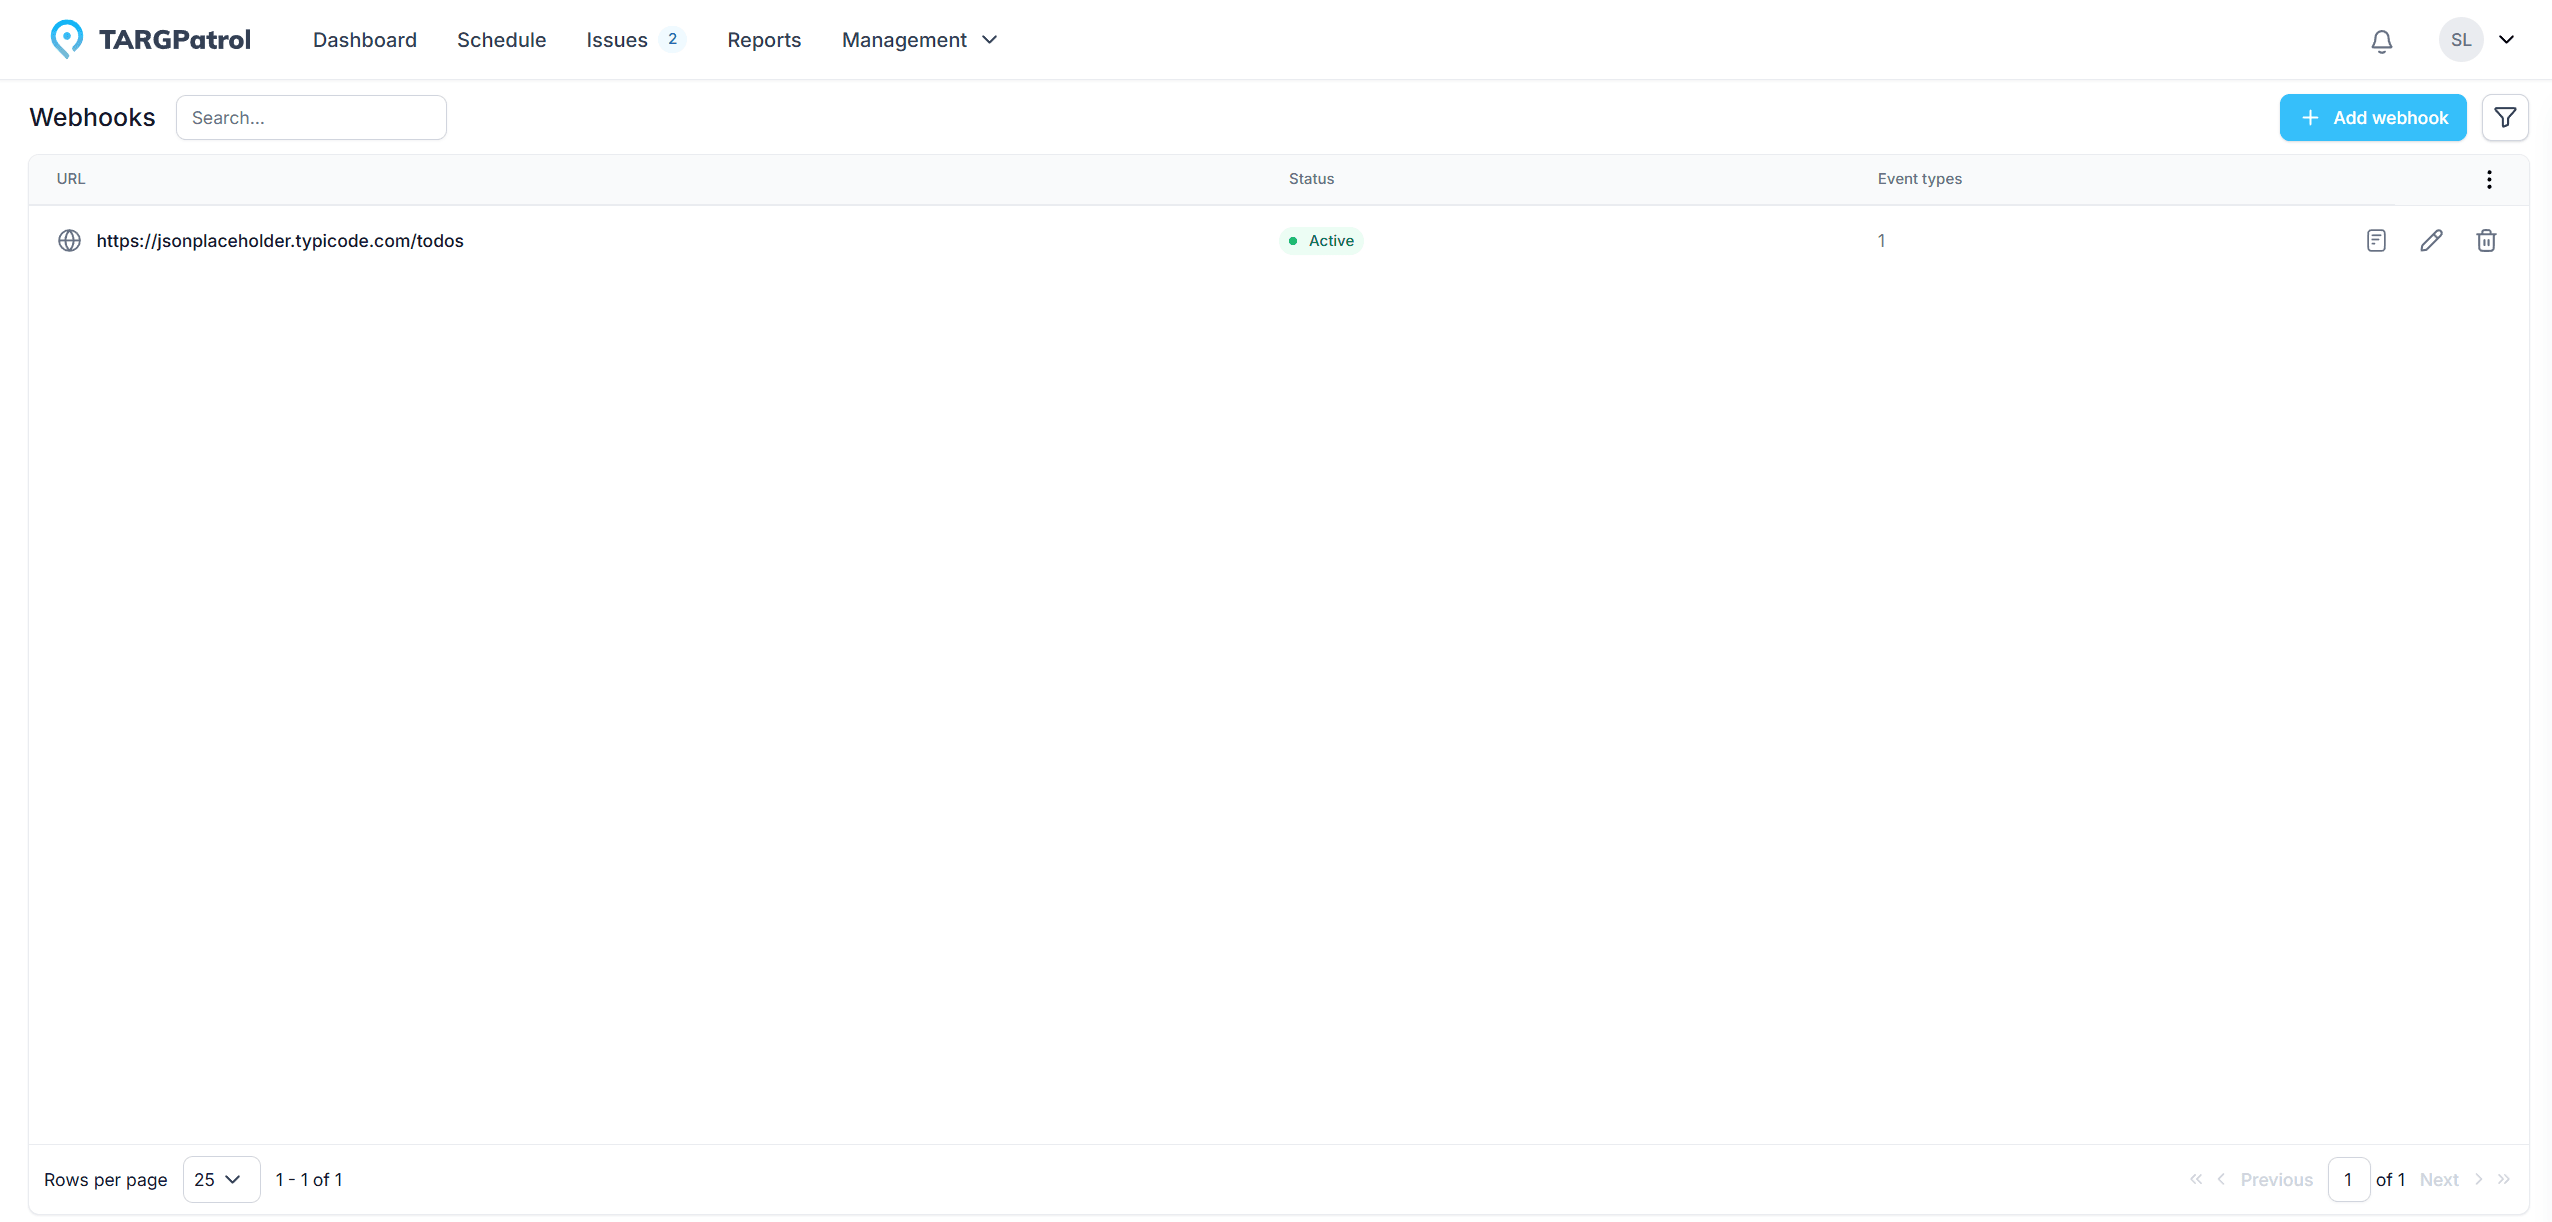
Navigate to the "Management" -> "Webhooks" section.

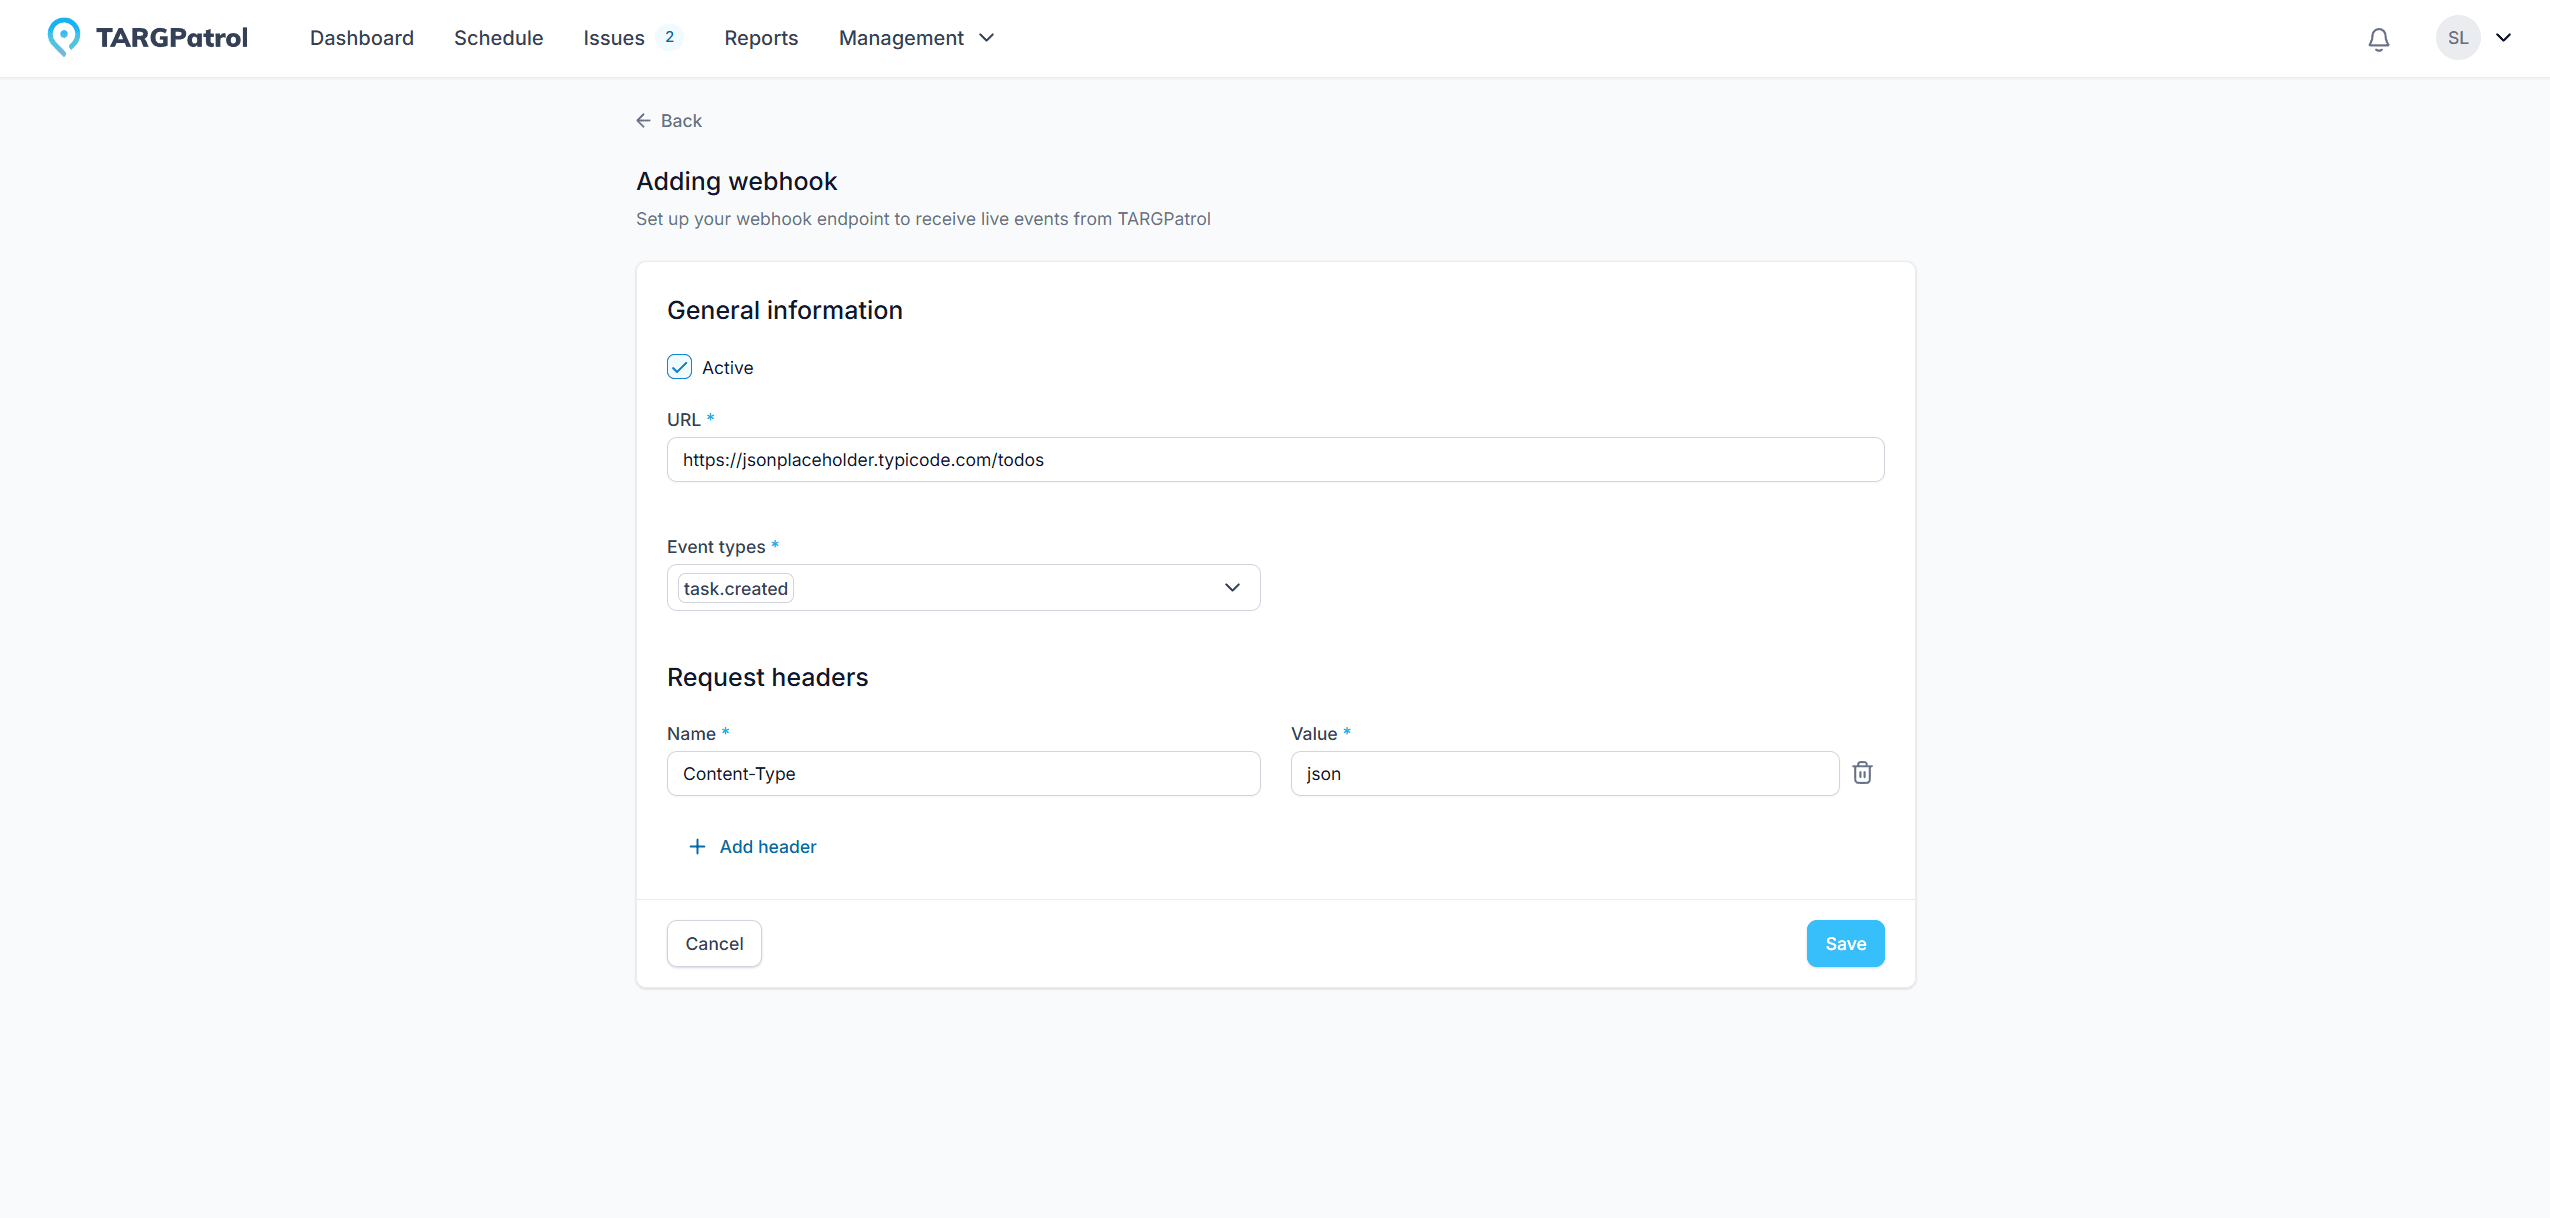
Click the Add Webhook button.
Enter the URL where notifications should be sent. Make sure your server is ready to handle POST requests and process JSON data.
Select the types of events that will trigger the webhook. TARGPatrol supports various triggers.
Optional: Add request headers: If needed, specify headers like Content-Type to customize the request format.
Click "Save" button.

After saving, TARGPatrol allows you to test the webhook by simulating an event.
For example, if your webhook is set to trigger on task.created, you’ll receive a notification when a new task is created.
Viewing Webhook Logs in TARGPatrol
Open the “Webhooks” section in TARGPatrol.
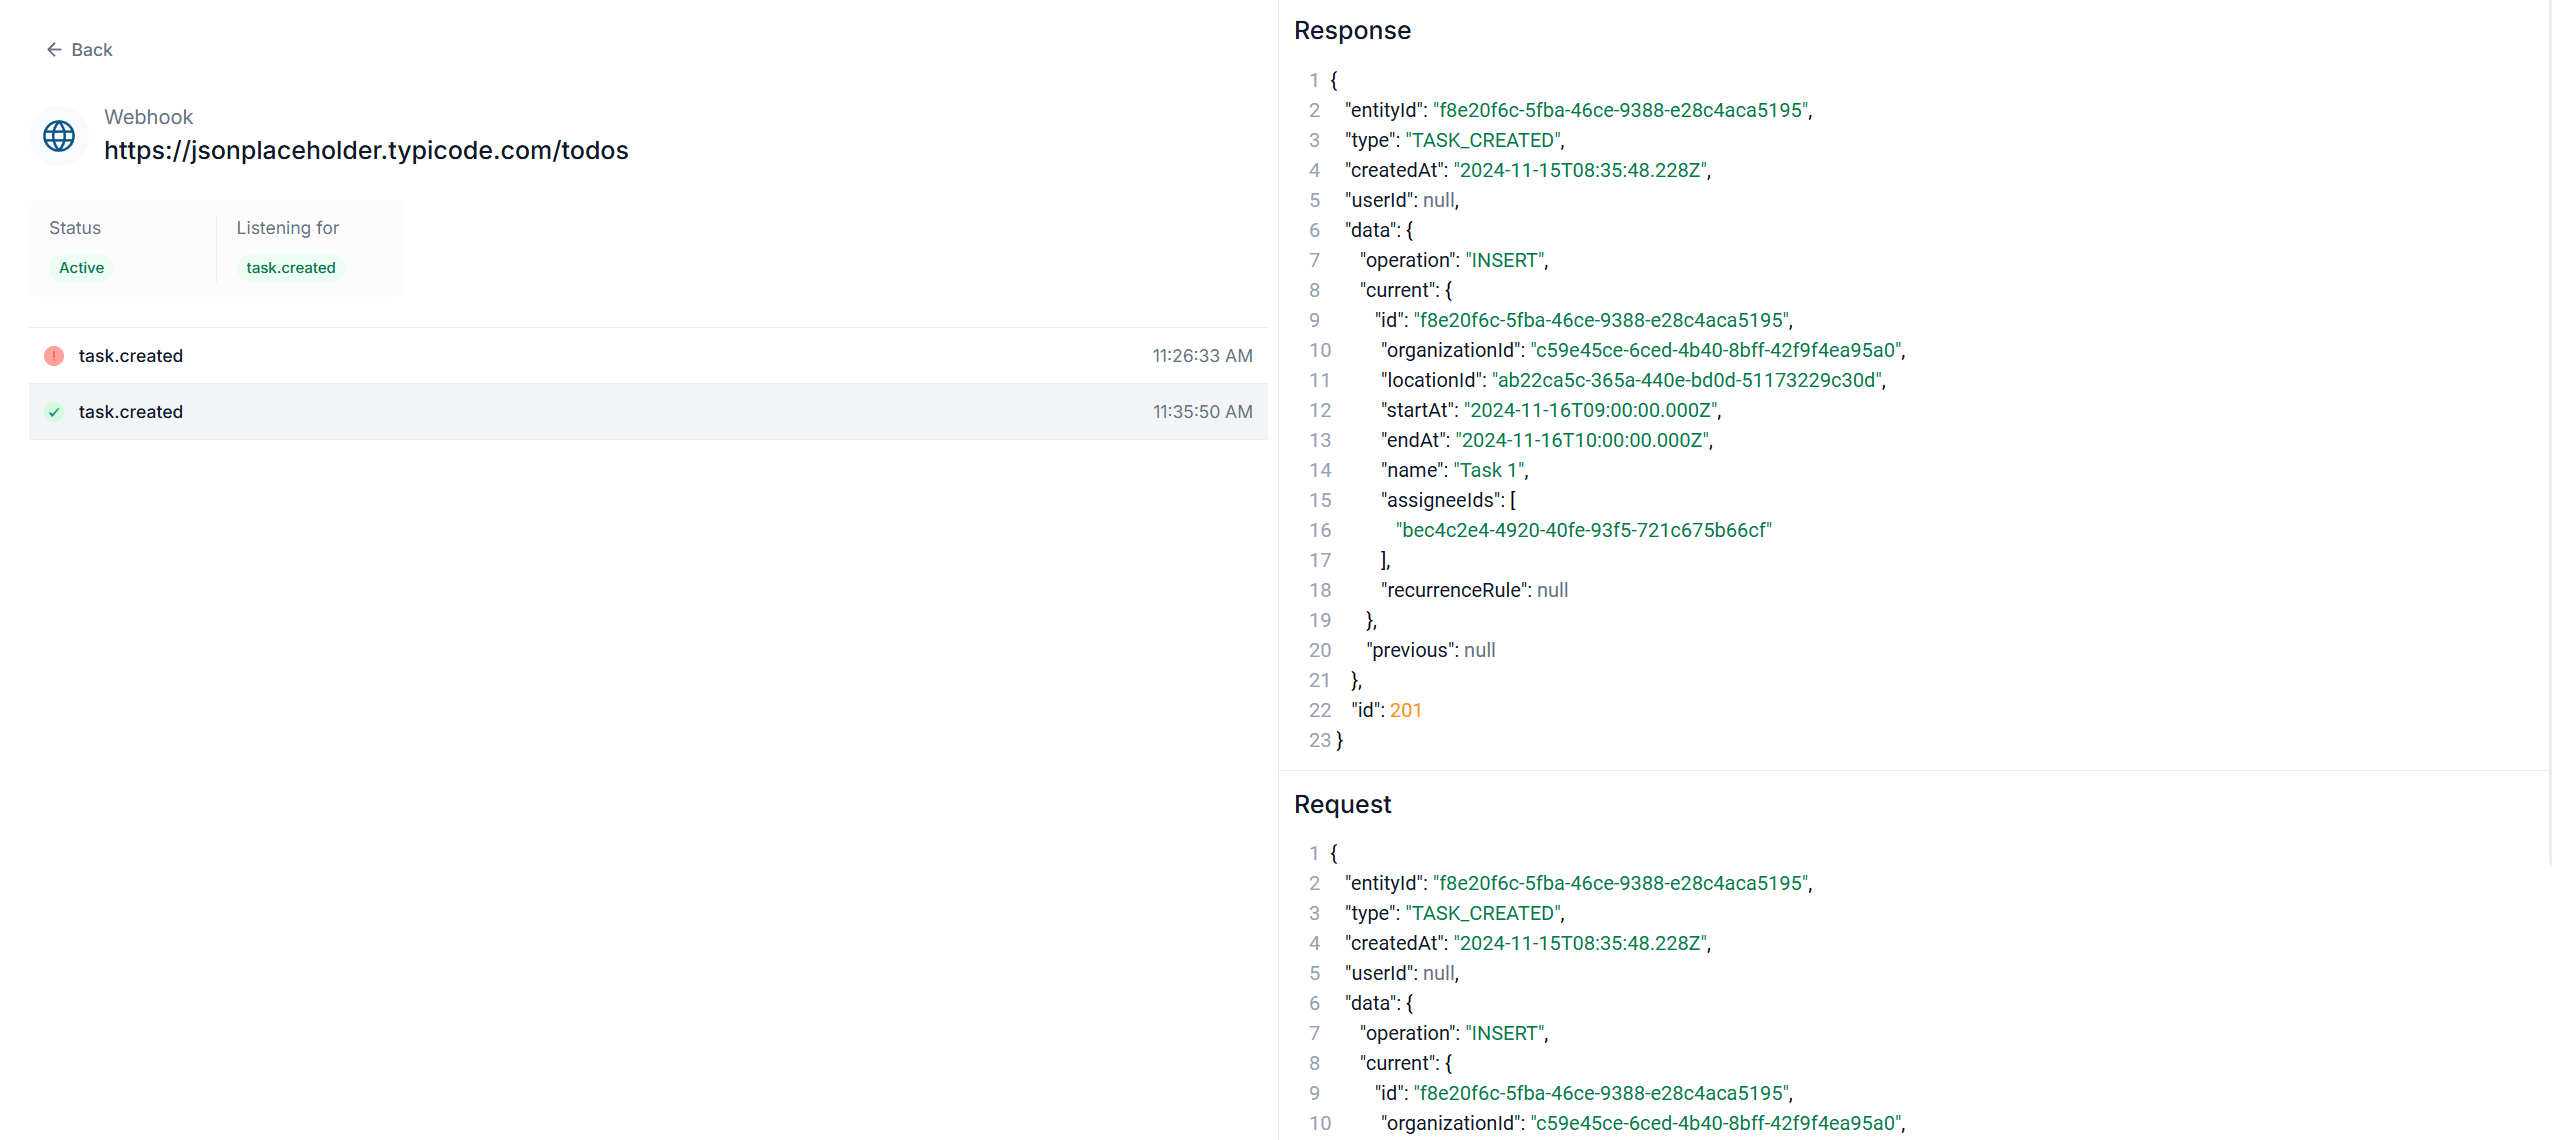
Click on the webhook URL or its icon to view its details.
A window will show a list of triggered events, including their status, request payloads, and server responses.
Check for errors: If a webhook fails, the corresponding request will be marked with an error icon in the logs. TARGPatrol will automatically disable a webhook after 25 consecutive failed requests.

Tips for Managing Webhooks
Handle errors gracefully: Webhooks run in real time, but if your server doesn’t respond, TARGPatrol retries the request automatically.
Monitor and analyze errors: Recurring issues, like timeouts, may indicate server performance problems or routing misconfigurations.
Stay informed: TARGPatrol sends email alerts when new webhooks are created, errors occur, or a webhook is automatically disabled. This keeps you informed about the health of your integration.
Use HTTPS for security: TARGPatrol webhooks only support secure HTTPS URLs to ensure data safety.


